I attended David Phillip’s lecture on weather and climate change in early March and was inspired to write a series of articles with the goal of elaborating on many points that he made in his ‘factoid’ filled presentation.
First up is the jet stream.
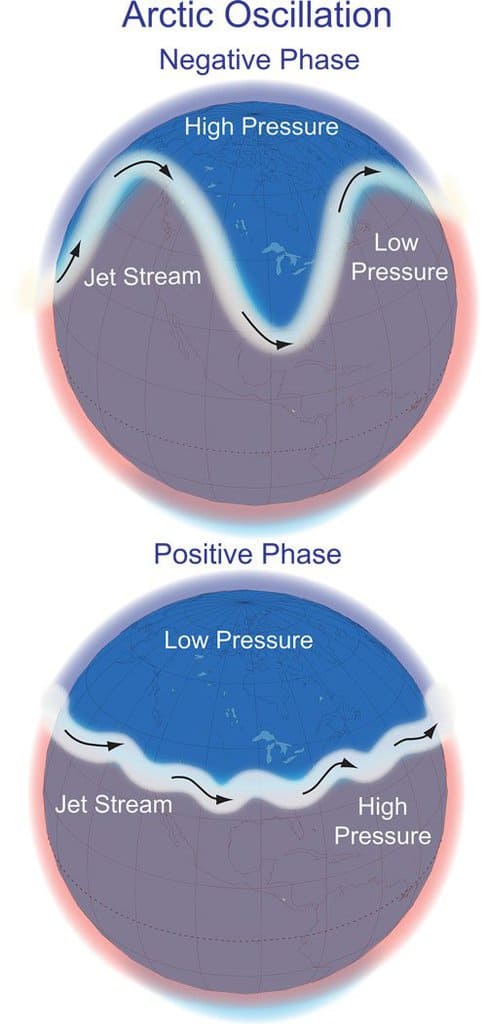
The illustration above is taken from the US National Weather Service. (NOAA) It shows the typical line on the map that represents the jet stream, but it misses one important point. The jet stream is not a line or an entity, or even a river as described below. It is a strong wind that results when air masses are being pushed together. Not labelled in the illustration are the arctic air mass, equatorial air mass and the mid-latitudes where there are modified air masses.
 On a very basic level, the jet stream is the boundary between cold and warm air. The polar regions of the world create cold air masses, especially in winter, when there is very little sunshine. The equatorial region produces warm air on a year-round basis. Cold air is dense and flows away from the polar regions. Warm air is less dense and rises. The mid-latitudes are where modified air masses are created. All of this air is trapped within the Earth’s gravitational field in a layer called the troposphere. That relatively thin layer is about 6,000 to 9,000 metres thick, about the height of Mount Everest.
The restricted space of the troposphere means that the warm and the cold air masses will end up pushing against each other. The forces between the air masses are affected by the relative density of the air, the spin of the Earth, the time of year, the Earth’s surface and the latitude. As my weather instructor told me in very unscientific terms, the force created when air masses push against each other is similar to the force that will eject a watermelon seed when squeezed between your thumb and forefinger! Who hasn’t done that? The watermelon seed represents the jet stream!
The pushing between the arctic air masses and warmer air masses forms the jet stream and it tends to flow from west to east due to the spin of the Earth. At high altitudes, there is less resistance from the Earth’s surface, so the wind speed is maximized and can be 250 to 300 kph. The other factors, already mentioned, create waves in the jet stream that result in an oscillating wave around the planet.
These waves can most easily be observed at the 6,000 metre level in the atmosphere, which is about the height of Mount Logan. TV weather now includes this upper air information as a colour graphic, known as the 500mb level. Blue and red represent cold and warm air. It is a big improvement in helping the public to understand weather. The upper air data is obtained by soundings that are done twice a day, in Whitehorse and at stations around the world.
Generally, there are about four to six waves in the jet stream circling the globe at any given time. These waves are bulges of cold air pushing south and warm air pushing north. The ‘polar vortex’ happens to be a trough in one of the waves, which is simply a southward bulge of the arctic air mass. These bulges can break away from the main arctic air mass and travel as far south as Maui, creating winter rain and wind and even some snow on top of Mount Haleakala.
In recent winters, we have heard big headlines about warm air invading the arctic. The phenomenon is not new. Warm air is pushed into the arctic regions when the cold air, the dreaded ‘polar vortex,’ pushes southward, (usually over Toronto, where most of our media headlines originate.) The restricted space within our troposphere means that when cold air displaces warm air, it has to move somewhere. Sometimes the warm air pushes well north of the Arctic Circle. The jet stream is at the leading edge of these air masses.
News headlines such as ‘a loopy jet stream’ and ‘polar vortex’ create drama and even fear but knowing more about the atmosphere and weather patterns can help us to understand unusual or extreme weather.
The atmosphere is a complicated mixture of gases affected by differential heating and cooling and there is no doubt that human activities are part of the equation. More on that in future articles.


